
Welcome to another educational Crypto Jargon post, the series where I break down the complex terms that we use in the blockchain and crypto space.
Today’s terms include:
SUPPORT & RESISTANCE, FIB Levels, H&S, EW, RSI, MACD and WEDGE Pattern.
Starting with Support and Resistance, which are undoubtedly the most discussed forms of technical analysis.
When analysing chart patterns, these terms are used by traders to refer to price levels that tend to act as barriers, preventing the price of an asset from getting pushed above or below certain value.
In simple terms, a Support occurs where a downtrend is expected to pause, due to a concentration of demand which means, there are a lot of buyers willing to take action when the price reaches that level, thus preventing the asset’s value from further decline…at least for a short period of time.
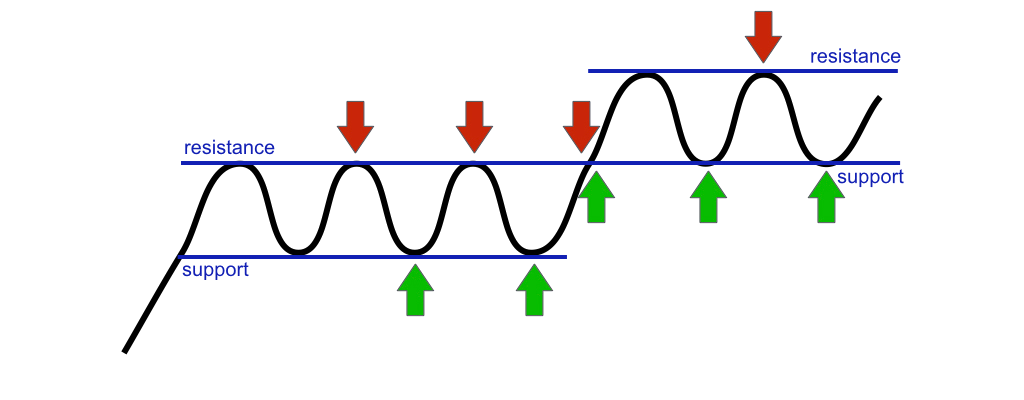
Same goes for Resistance but in reverse. When the prices are going up, there comes a point where the market finds it hard to keep rising and this is the resistance level. It is because there is less demand for that coin at that price, hence why we say that there is resistance from buyers. Or this could happen because there’s a lot of sellers that are happy to close positions at this price level, creating more supply which holds the prices from going any higher. What’s interesting about support and resistance is that once a resistance gets broken and the price goes way above that level, it becomes the support for the future. So if prices retract, there are usually expected to stop and find support at that level.
FIB is short for Fibonacci Levels or Fibonacci Retracement which is a technical analysis system that is used to identify potential support, resistance and reversal levels. Fibonacci retracement is a mathematical sequence developed in the 13th century by the Italian mathematician of the same name. The sequence of numbers, starting with zero and one, is created by adding the previous two numbers. The Fibonacci sequence is significant because of the so-called golden ratio of 1.618, or its inverse 0.618.
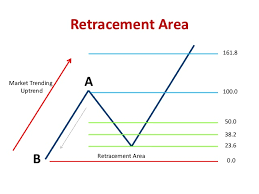 In the Fibonacci sequence, any given number is approximately 1.618 times the preceding number, ignoring the first few numbers. Common Fibonacci numbers in financial markets are 0.236, 0.382, 0.618, 1.618, 2.618 and 4.236. These ratios or percentages can be found by dividing certain numbers in the sequence by other numbers and this is how support and resistance can be identified during Technical Analysis.
H&S stands for Head-and-Shoulders Pattern which is a chart formation that resembles a baseline with three peaks, the outside two are close in height and the middle is highest. In technical analysis, a head and shoulders pattern predicts a trend reversal from bullish to bearish, in other words, prices are about to decline even further after the pattern has been formed.
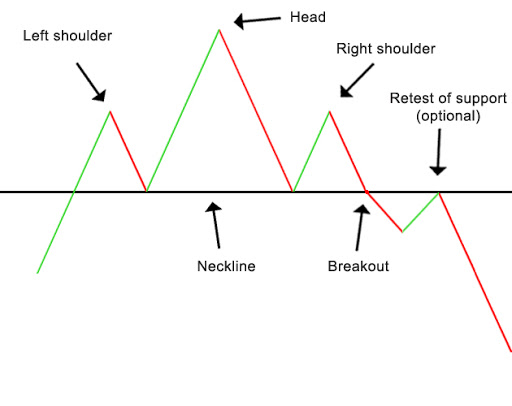
The head and shoulders pattern is believed to be one of the most reliable trend reversal patterns. It is one of several top patterns that signal, with varying degrees of accuracy, that an upward trend is nearing its end. It can also appear in reverse, which is known as “Reverse H&S” and indicates that a bearish trend is broken and prices are going to keep rising, entering a bull trend.
EW stands for Elliot Waves and it’s another chart pattern traders use. It originates from Ralph Nelson Elliott an accountant who published The Wave Principle in 1938. His theory of pattern recognition argues that market trends unfold in five waves when travelling in the direction of a primary impulse and 3 waves when opposing that impulse. In most simple terms, the price moves five waves in one direction as a trend and 3 waves in the opposite direction as a correction. These can be further divided into sub-waves and also depending on the time frame, they can be many sub-waves into any one of the larger waves so I shall stop here before it gets too complicated.

Moving on to RSI. This stands for Relative Strength Index – a momentum indicator that measures the magnitude of recent price changes to evaluate overbought or oversold conditions in the price of a coin or any asset really. The RSI is displayed as an oscillator (a line graph that moves between two extremes) and can have a reading from 0 to 100. The indicator was originally developed by J. Welles Wilder Jr. and introduced in his 1978 book, “New Concepts in Technical Trading Systems”.
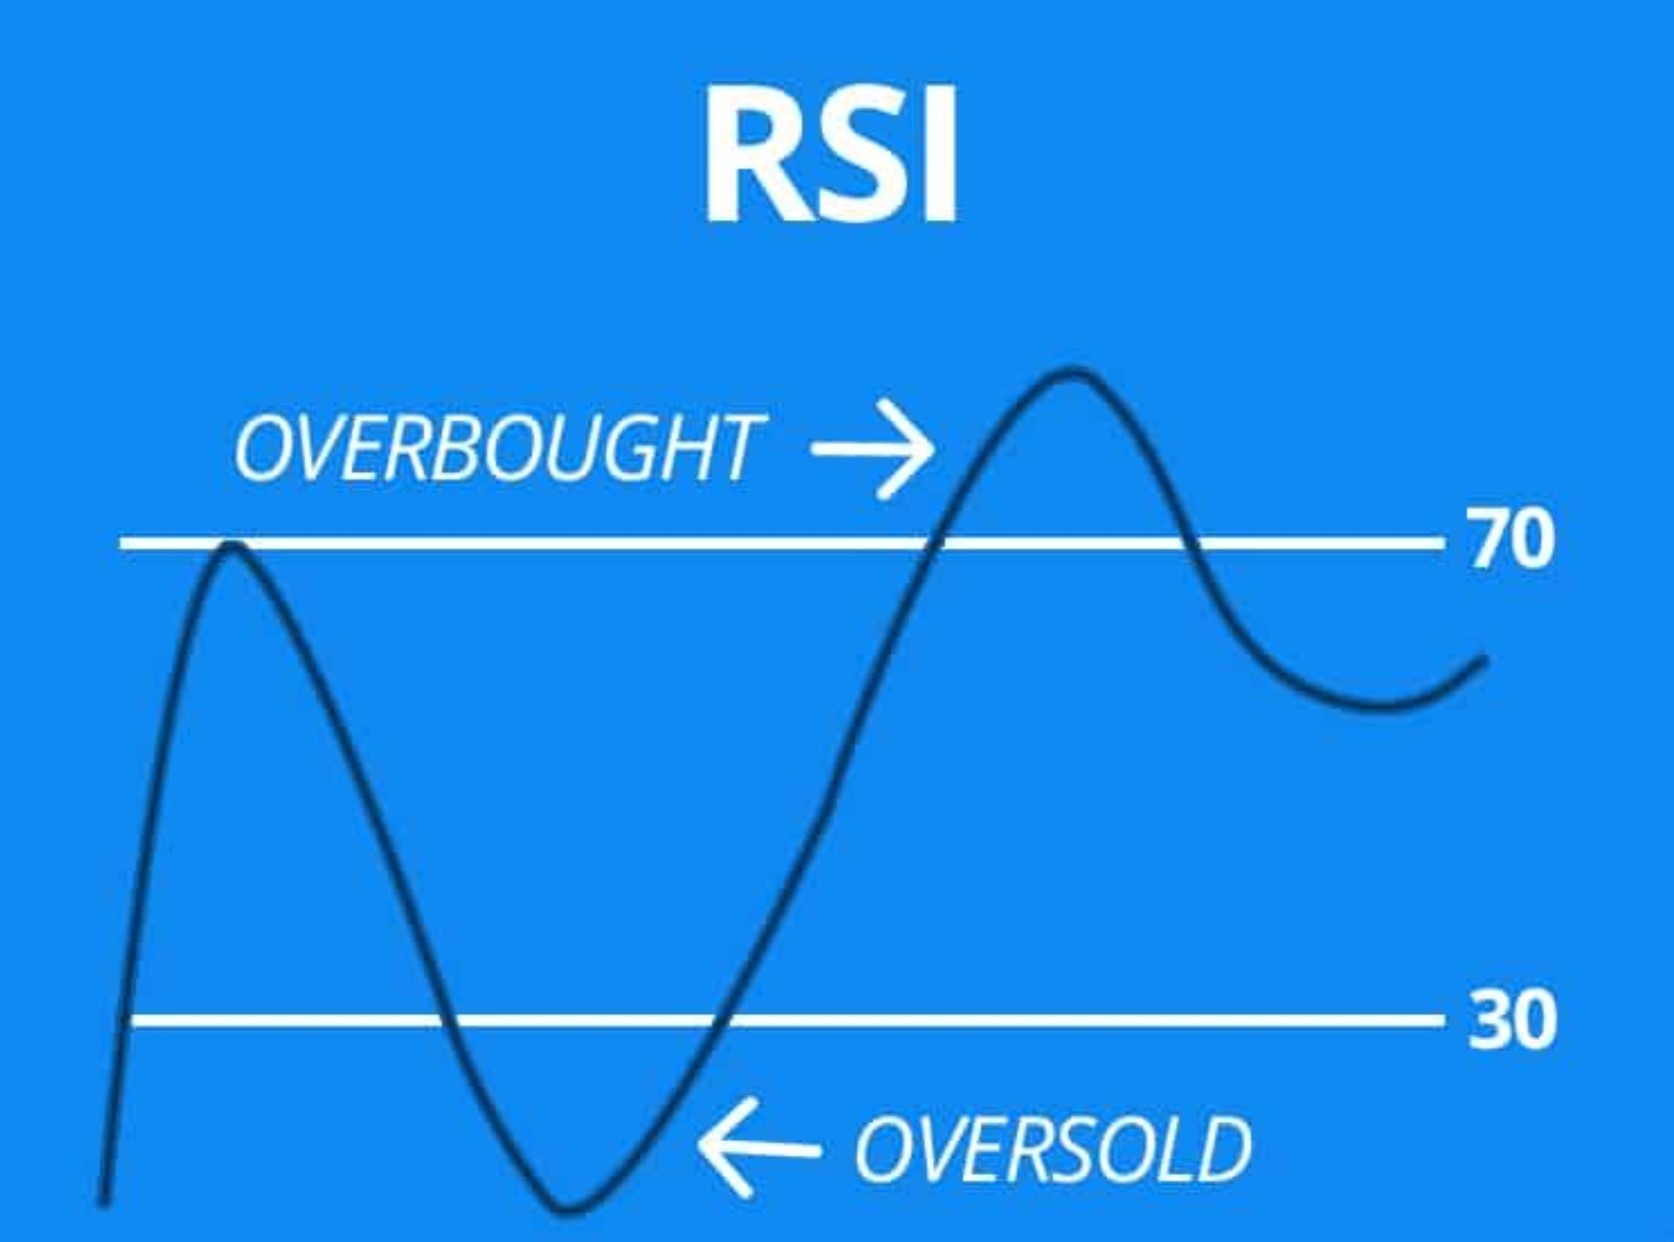
In very simple terms, an asset is considered overbought if the RSI is going to or above the 70 range and oversold, when the indicator points to or below the 30 range. There’s much more to it of course, but I’m keeping this short and easy so let’s move on to the next.
MACD – Moving Average Convergence Divergence is a trend-following momentum indicator that shows the relationship between two moving averages of an asset’s price. The MACD is calculated by subtracting the 26-period Exponential Moving Average (EMA) from the 12-period Exponential Moving Average (EMA).
The result of that calculation is the MACD line. A nine-day Exponential Moving Average, called the “signal line,” is then plotted on top of the MACD line, which can function as a trigger for buy and sell signals.
Traders may buy the asset when the MACD crosses above its signal line and sell – or short – the asset when the MACD crosses below the signal line. In most simple terms, when the MACD falls below the signal line, it is a bearish signal which indicates that it may be time to sell. Conversely, when the MACD rises above the signal line, the indicator gives a bullish signal, which suggests that the price of the asset is likely to experience upward momentum.
And now onto the last term for this episode – Wedge.
A wedge occurs in technical analysis when trend-lines drawn above and below a price series go into an arrow shape. This patterns are thought by technical analysts to be useful in analysing a short to intermediate term reversal from the current major price trend. There are three most common types of wedge patterns:
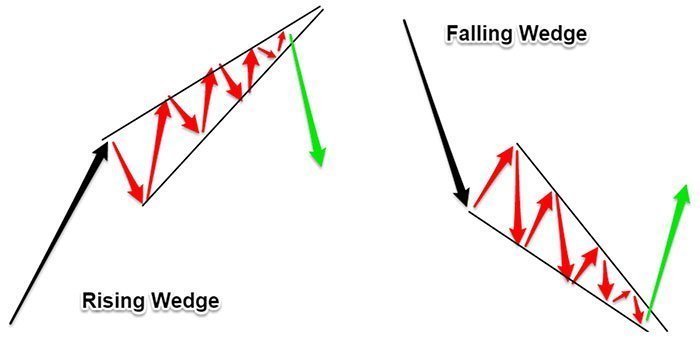
–Rising Wedge. This wedge shape is tilted upward; thus the name. However, a rising wedge occurs during a downward trend, or “bear” market. It’s a momentary upward shift, but the bear market continues afterwards.
–Falling Wedge. The falling wedge is tilted downward. It represents just the opposite of the rising wedge, in that it denotes a brief downward movement during a “bull” market, which continues once the wedge is formed.
–Level Wedge. These appear to move in more or less a horizontal direction on a graph. Just like the rising and falling wedges, the level wedge shows a brief respite in a trend, which will continue once the wedge pattern is complete.

Enjoying this content?
Go check out “Crypto Jargon A-Z” — eBook (second edition out now).
It’s an Amazon Best Seller and it’s the most up-to-date Crypto Dictionary with more than 700 terms, acronyms and trading slang related to cryptocurrencies and blockchain tech.
Just go to ojjordan.com/cryptojargon and grab your digital copy at a super-discounted price directly from my website (Amazon price is $10.99 – you get it for $1.99 on my website).

Other posts you might like:

What a great post. Thank you for sharing this! I’m going to send it to all my friends.
LikeLike
cialis label
LikeLike
https://buypriligyhop.com/ – Priligy
LikeLike
Zithromax
LikeLike
http://buylasixshop.com/ – Lasix
LikeLike
Levaquin Visa
LikeLike
Hi thanks for shariing this
LikeLike