
Welcome to another Crypto Jargon article.
In a previous post I outlined what is Support and Resistance, also a Breakout and a few of the indicators that help forecast them, and I also mentioned the Wedge Pattern, which is one of the patterns signalling a bullish or bearish potential. In this post I will add some more patterns that we observe that can help us to forecast possible uptrend or downtrend moves.
You can also catch the video version of this post:
Let’s begin.
On a very basic level, chart patterns are a way of viewing a series of price actions. It can be over any time frame – monthly, weekly, daily or even shorter. The great thing about chart patterns is that they tend to repeat themselves over and over again so by recognising these patterns, traders gain a better picture about the markets and use them to identify trend reversals and continuations.
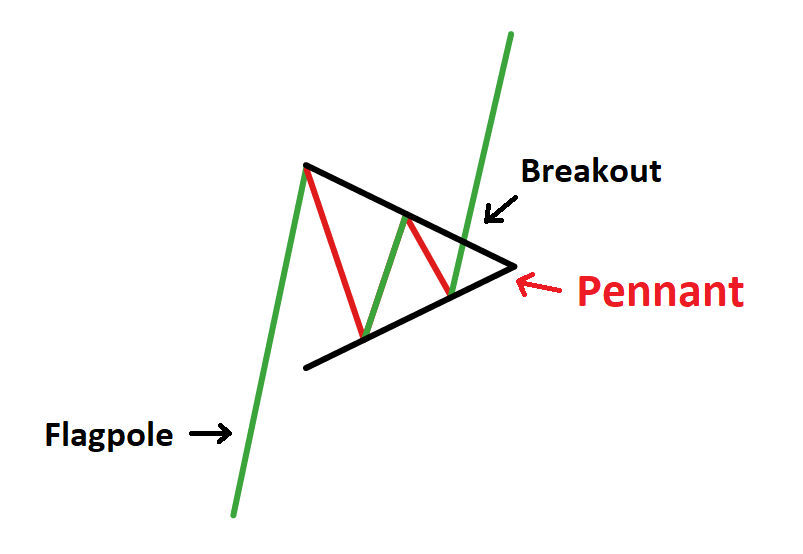
First I will start with the Pennant – this is a pattern created when there is a significant movement in the price, followed by a period of consolidation – this creates the pennant shape due to the converging lines. A breakout movement then occurs in the same direction as the big move. These are similar to flag patterns and tend to last between one and three weeks. There will be significant volume at the initial price movement, followed by weaker volume in the pennant section, and growth in volume again at the breakout.
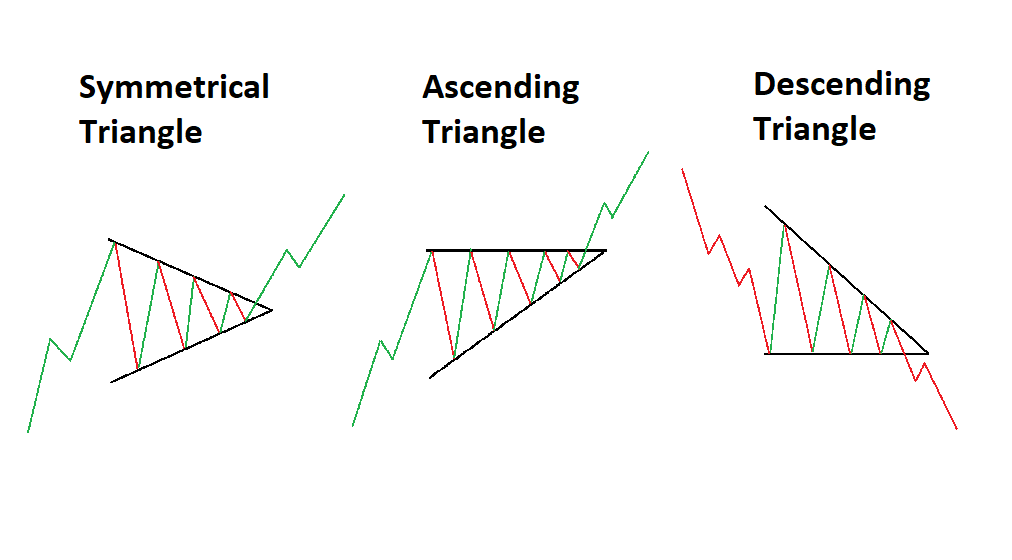
Ascending Triangle
This triangle usually appears during an upward trend and is regarded as a continuation pattern. Sometimes it can be created as part of a reversal at the end of a downward trend, but more commonly it is a continuation and at the same time is signalling a bullish scenario.
The opposite is a Descending Triangle
Also a continuation pattern, but this triangle is a bearish signal and is usually created as a continuation during a downward trend. Occasionally it can be seen as a reversal during an upward trend (the opposite of the ascending triangle pattern), but it is mostly considered to be a continuation pattern.
Symmetric Triangle
The symmetrical triangle pattern is easy to spot thanks to the distinctive shape which is developed by the two trendlines which converge.
This pattern occurs by drawing trendlines, which connect a series of peaks and lows. The trendlines create a barrier, and once the price breaks through these, a very sharp movement in price follows. The breakout signals the start of a bull run which could be quite a jump, with a lot of volume and significant price increase.
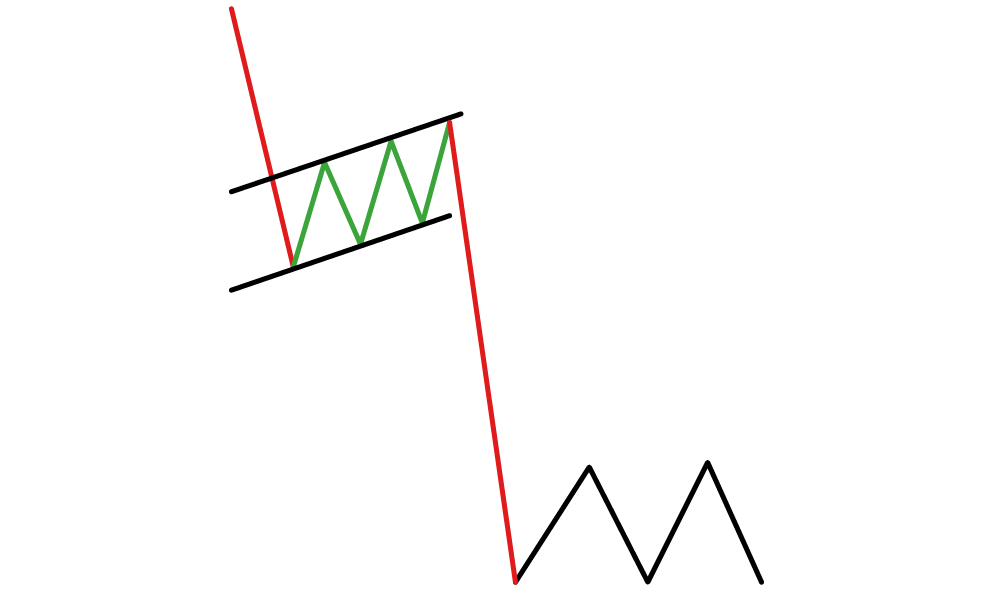
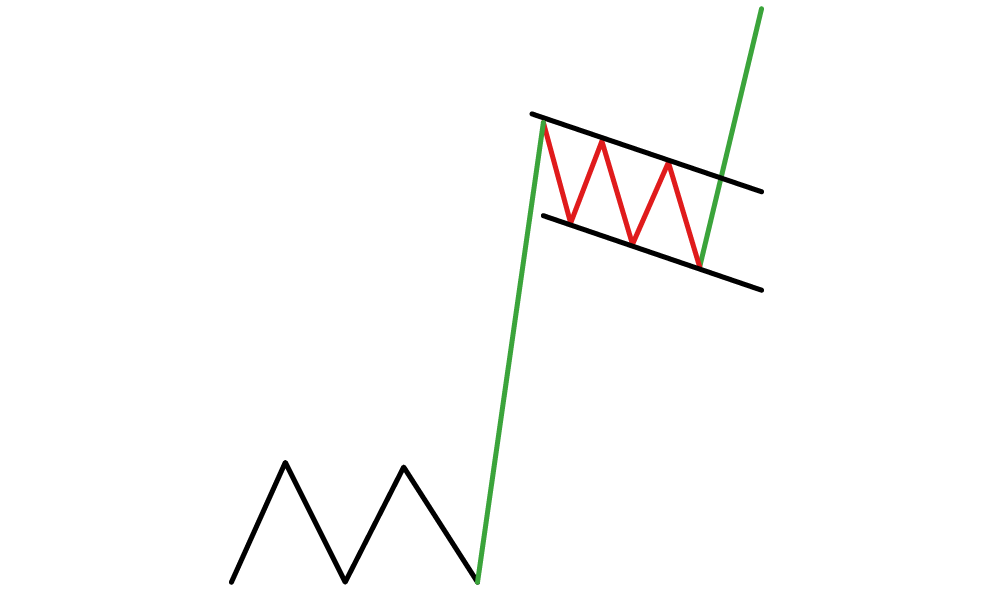
Flag Continuation
The flag stock chart pattern forms through a rectangle. The rectangle develops from two trendlines which form the support and resistance until the price breaks out. The flag will have sloping trendlines, and the slope should move in the opposite direction to the original price movement. Once the price breaks through either the support or resistance lines, this creates the buy or sell signal.
Triple Bottom Pattern
This forms over time as the prices move between support and resistance and test the support again and again, but each time the support holds strong which can form three distinct and almost-equal valleys on the chart’s trendline. Once the third valley has formed, an upward trend will develop past the point of the peaks formed during the pattern’s formation. When this happens, the market is likely to be bullish for a while and the triple bottom pattern is considered a reversal pattern, transitioning from a bear to a bull market.
This happens in reverse too with the Triple Top Pattern.
It forms on a market chart when the resistance is tested multiple times which forms three distinct and almost-equal peaks. If the third time this resistance does not get broken, then a downward trend will develop past the point of the previous dips indicating a bearish or downward-trend has begun. The triple top pattern is considered a reversal pattern, transitioning from a bull to a bear market.

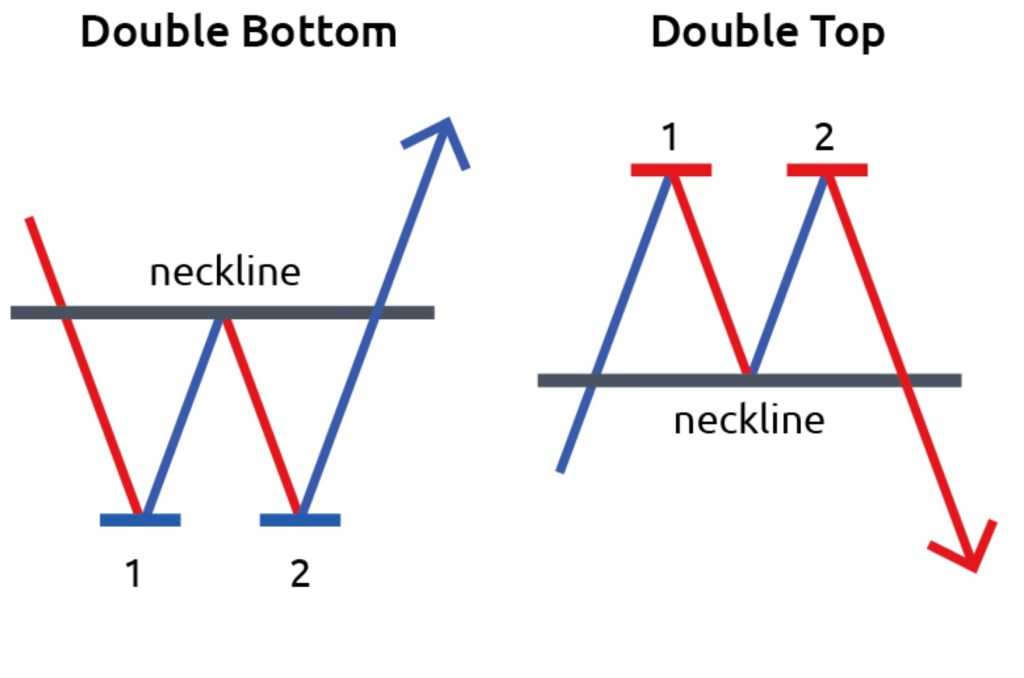
This can happen also just after two tests of the resistance, which we call a Double Top.
Most likely this would be observed over a larger period of time, such as the weekly timeframe and it’s the same as the triple top but without the third peak. Two peaks of almost identical shape are formed and after that the price goes in a downward trend for a while. This is because the sellers are putting pressure on the market at the price level where the peak forms and the buyers are unable to push that price any higher, either they’re not ready to buy at such price or there are more sellers who sell at that price level so there’s more supply which caters to the demand and surpasses it, which in return creates a devaluation and the price plummets.
This pattern is considered a reversal pattern, transitioning from a bull to a bear market.
This can also happen in reverse, which is the Double Bottom.
This pattern shows how we test the support level to see if we can push any lower but as we get rejected twice, as soon as the second valley has formed, an upward trend will develop past the point of the tops formed during the pattern. It’s a signal that the market is likely to be “bullish,” thus the double bottom pattern is also a reversal pattern, transitioning from bear to bull market.
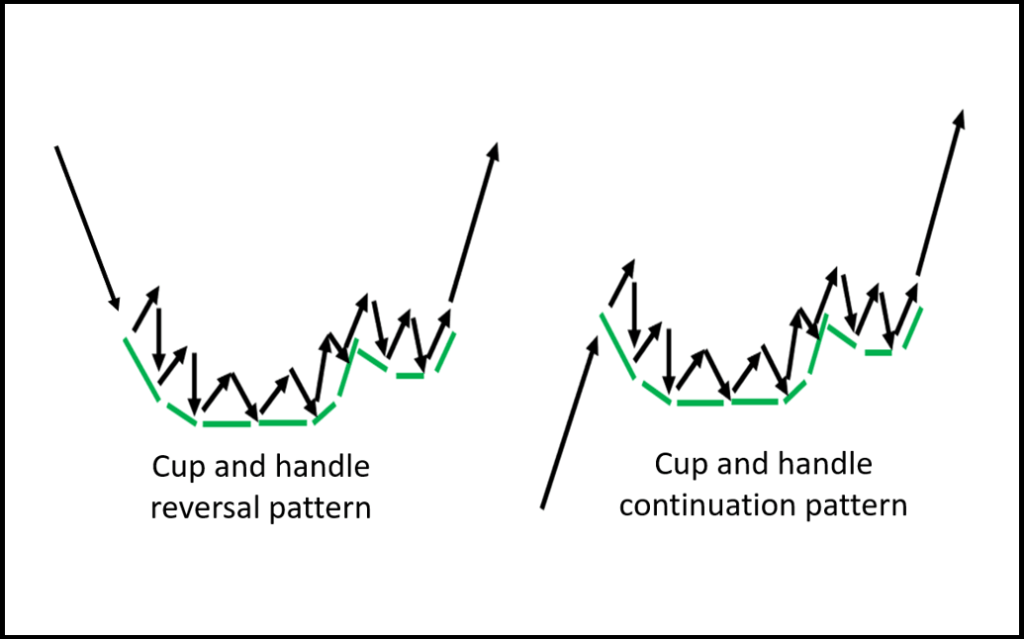
A Cup and Handle pattern gets its name from the obvious shape resemblance on the chart. The cup is a curved u-shape, while the handle slopes slightly downwards. In general, the right-hand side of the diagram has low trading volume, and it can last from seven weeks up to around 65 weeks so this is a longer-term chart analysis and is not used much with hourly or shorter candlesticks but mainly with daily and weekly candlesticks. It is a bullish indicator showing a trend reversal from a long-term bearish to a bullish market. In some cases it can also be a continuation indicator, as seen in the example below.
Similarly looking is the Rounding Bottom but in this case, there is no handle to the pattern, hence the name.
This pattern is sometimes also called a “saucer bottom” and also demonstrates a long-term reversal showing that the asset is moving from a downward trend towards an upward trend. It can last from several months to years.

Enjoying this content?
Go check out “Crypto Jargon A-Z” — eBook (second edition out now).
It’s an Amazon Best Seller and it’s the most up-to-date Crypto Dictionary with more than 700 terms, acronyms and trading slang related to cryptocurrencies and blockchain tech.
Just go to ojjordan.com/cryptojargon and grab your digital copy at a super-discounted price directly from my website (Amazon price is $10.99 – you get it for $1.99 on my website).

Other Posts you might like:
Candlestick Charts, Depth Charts, Trading walls + Day Trading, Swing Trading & Position Trading Explained
This is one of my Crypto Jargon series where I’m breaking down the complex crypto-related terminology. In this post I’ll explain what are Candlestick Charts, Depth Charts and Trading Walls will also discuss different types of trading such as Day Trading, Swing Trading and Position Trading. Let’s start first with Candlestick charts. These originated in…
Atomic Swaps, DEX, OTC, Limit Order, Stop-Loss, Fill-or-Kill, Margin Trading & Wash Trading Explained
Welcome to another edition of my short series “Crypto Jargon” In this article I will break down the following terms: Wash trading OTC Limit order Fill or Kill order Stop order Margin trading Atomic swaps DEX I’m going to start with OTC which is an acronym for Over-the-counter, which is a term for Off-Exchange Trading.…
What is Support & Resistance, RSI, MACD, H&S, Elliot Waves, Wedge Pattern?
Welcome to another educational Crypto Jargon post, the series where I break down the complex terms that we use in the blockchain and crypto space. Today’s terms include:SUPPORT & RESISTANCE, FIB Levels, H&S, EW, RSI, MACD and WEDGE Pattern. Starting with Support and Resistance, which are undoubtedly the most discussed forms of technical analysis.When analysing…
What is Crypto Dust | Dusting Attacks Explained
Here is a form of a cyber attack that is largely unknown to users in the crypto space and I feel it’s time to bring it to your attention. Throughout my “Crypto Jargon” series I have discussed many types of cyber attacks and crypto-related threats that you should look out for and this one is…
Want to know how to make money by investing in crypto?
Grab a copy of my best-selling eBook “Learn Crypto”


Hi, Neat post. There’s a problem with your site in internet explorer, would check this… IE still is the market leader and a huge portion of people will miss your fantastic writing due to this problem.
LikeLike
Generic Levitra
LikeLike