
Bitcoin has been having some very impressive price action in the past three days and with a brief rally into the $70k region, sentiment is turning bullish once again. Everyone’s calling for the bottom being hit already and I even see some buzz about new ATH later this year.
Is this hopium? I think so.
Despite all the hype I am seeing on social media, I still maintain my conviction that the bottom has not yet been reached. So, let me defend my position and give you a few examples to back it up.
First, what happened in the last few days is a strong rally, supported by decent volume, that took Bitcoin from the $68k level all the way to the current resistance of $75k. Not a bad run in a short space of time. This pumped up the bulls and everyone suddenly is eyeing a jump to the $82k or even $86k resistance. We currently have the 200 EMA around $83k making this the obvious next rejection point, but even if we make that move, a drop to lower support is still on the table.
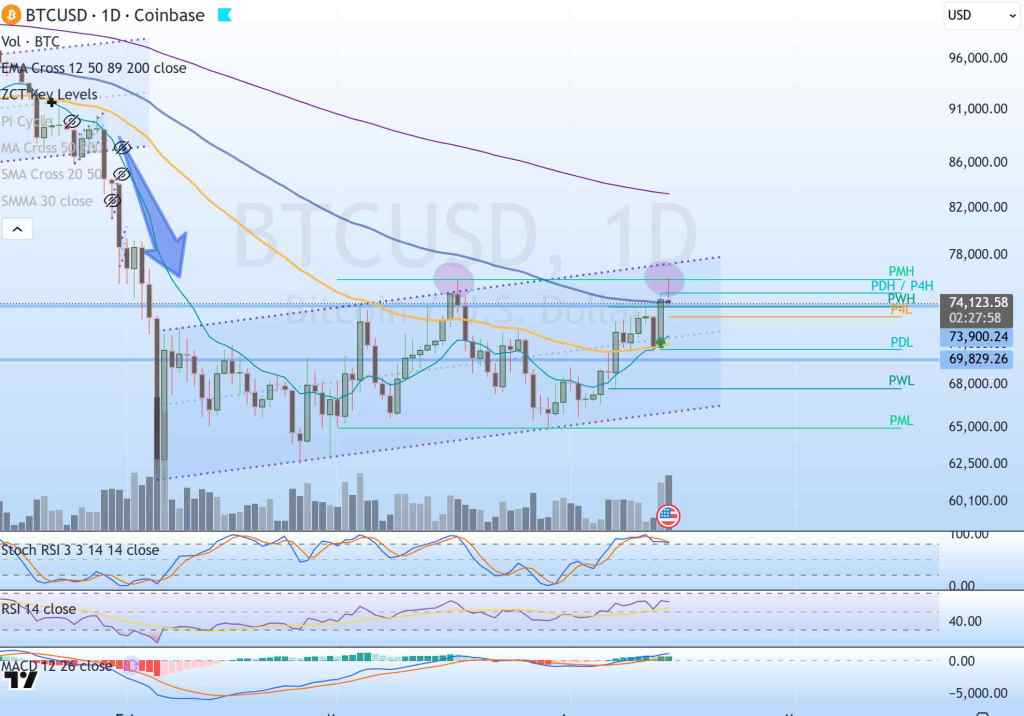
First, as you can see from the chart above, BTC is still trending within a range that forms a continuation (bearish) flag. This chart pattern typically breaks on the downside. We could still invalidate it by making a breakout from resistance, but the odds are not in favour of this.
Market focus now tightens around this pivotal range that separates short-term rebalance from multi-week expansion.
Buy-Side Defense Zone: The $73k region acts as a psychological and technical buffer. It aligns with the 10-day EMA and prior consolidation high, where whale accumulation and high spot inflows were previously observed.
Sell-Side Pressure Belt: Around $75k ($75,500) strong resistance forms.
It coincides with recent ETF profit-taking, a congestion of stop orders, and traders who bought the breakout rolling over derivative longs.
If price actions consolidate above this zone with strong volume, the market could confirm a structural trend extension; failure to hold pushes BTC back into a volatile, range-bound mode: what we call “the illusion of breakout.”
Simultaneously, ETF outflows and negative funding rates (−0.005%) show leveraged fatigue; validating whether these inflows rotate back after tax season will determine durability.
I’ve been looking at charts extensively over the last couple of days and I am of conviction that we are in the middle of this bear market.
Here are some examples to back this up.
MVRV Z-score chart:
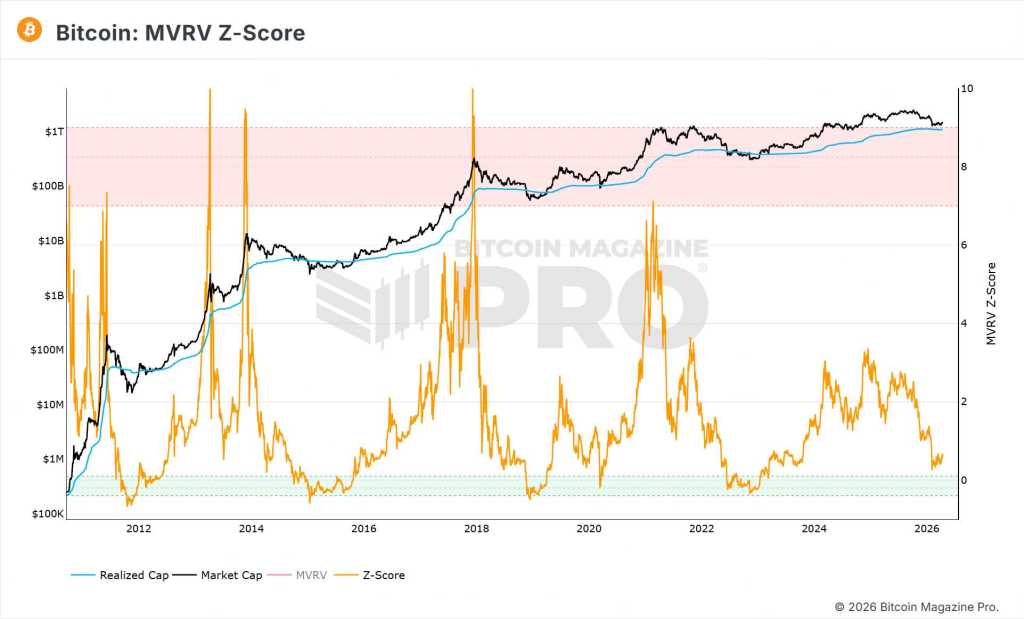
This is a Bitcoin chart that uses blockchain analysis to identify periods where Bitcoin is extremely over- or undervalued relative to its ‘fair value’ – useful for predicting Bitcoin price at the extremes of market conditions. Looking for cycle bottoms, the chart shows an overlap of the Z-score line and the lower green band. BTC price will rally usually after spending some time in the lower green band.
Not just touch and go, but actually stay there for weeks.
Every market bottom coincides with this crossover, and so far in this cycle we have not yet entered the lower green band, but we are coming close to it.
My conclusion: Bottom is ahead of us.
Next, I am looking at the BTC realized price – another metric that provides a good long-term outlook.
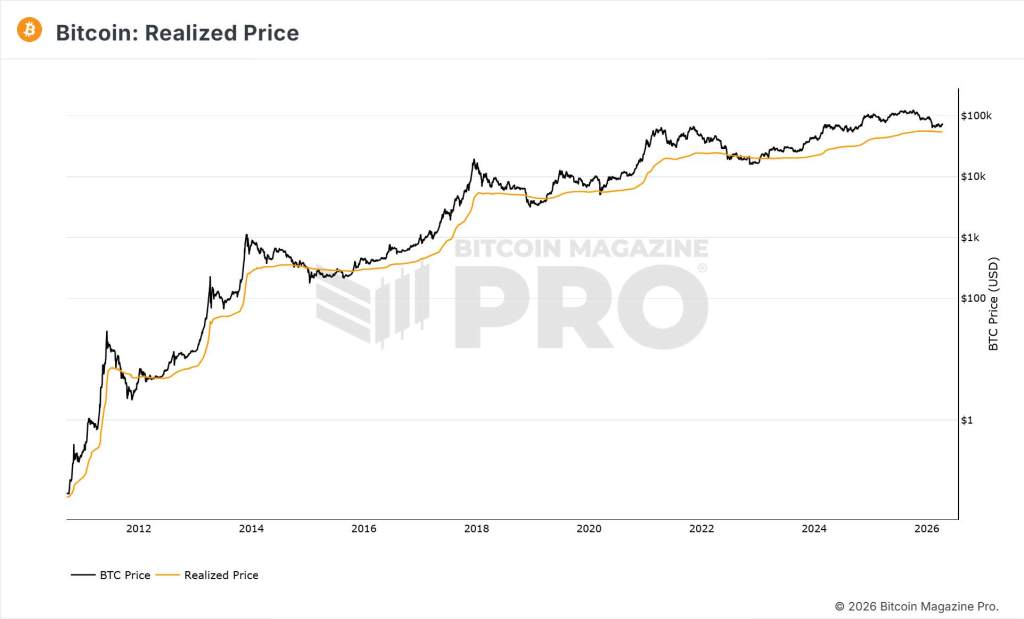
This metric shows when the market is under a period of distress. That is when the current Market Price drops below Realized Price, it stays below for a period of time (days/weeks) and marks a bottom.
Historically, these periods have occurred at all major cycle lows. This chart shows us that we are very close to the Realized Price, but not yet breaking below the orange line.
This also calls for a further price drop before we find a market bottom.
Okay, moving on to the 200 Daily Moving Average chart.
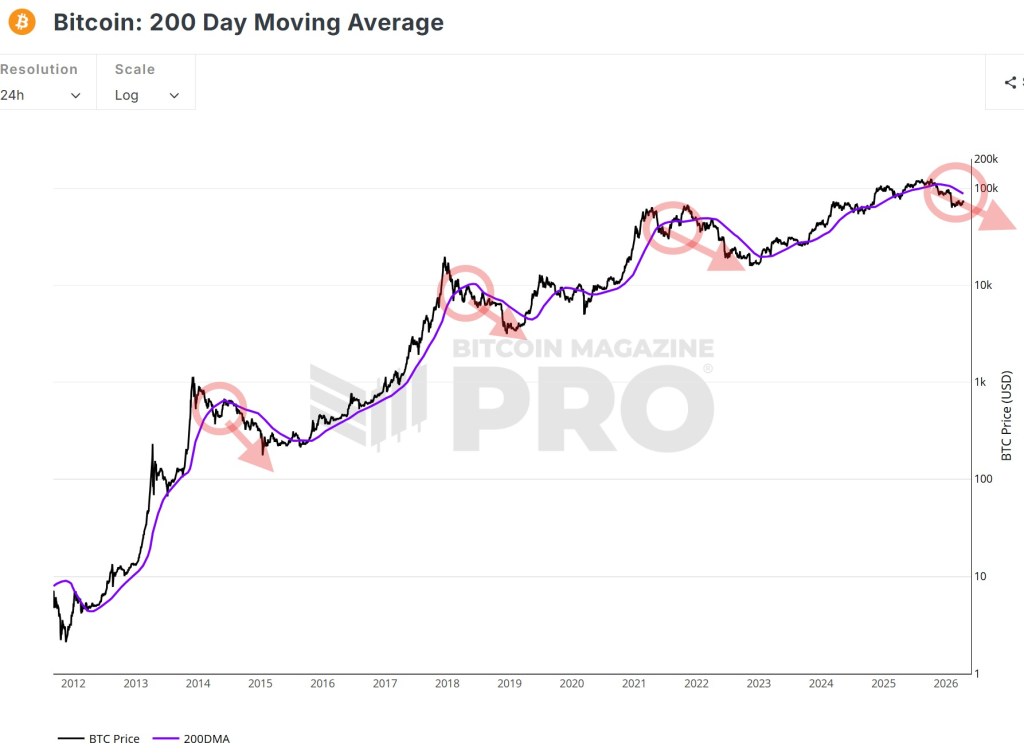
Here it’s even more obvious: Price crosses below the moving average, trends below that moving average for several months before printing a bottom, and soon after it crosses above, signalling the recovery is in play. We crossed that moving average four months ago, so we can expect a bottoming soon, but it’s still ahead of us.
By all means, any of these patterns from the past can be invalidated, and there’s no guarantee that the asset will perform similarly to previous cycles, but until I see a deviation from past performance, I have no reason to expect otherwise. These patterns have been established by the market performance over several cycles, and I don’t see convincing reasons to deviate now.
And then there’s the cycle duration overlap I want to point out here.
What I’m talking about is that in the past few cycles, the timing from top to bottom seems very much aligned.
It’s remarkable to see how precise these cycles end up being when you zoom out and look at the bigger picture.
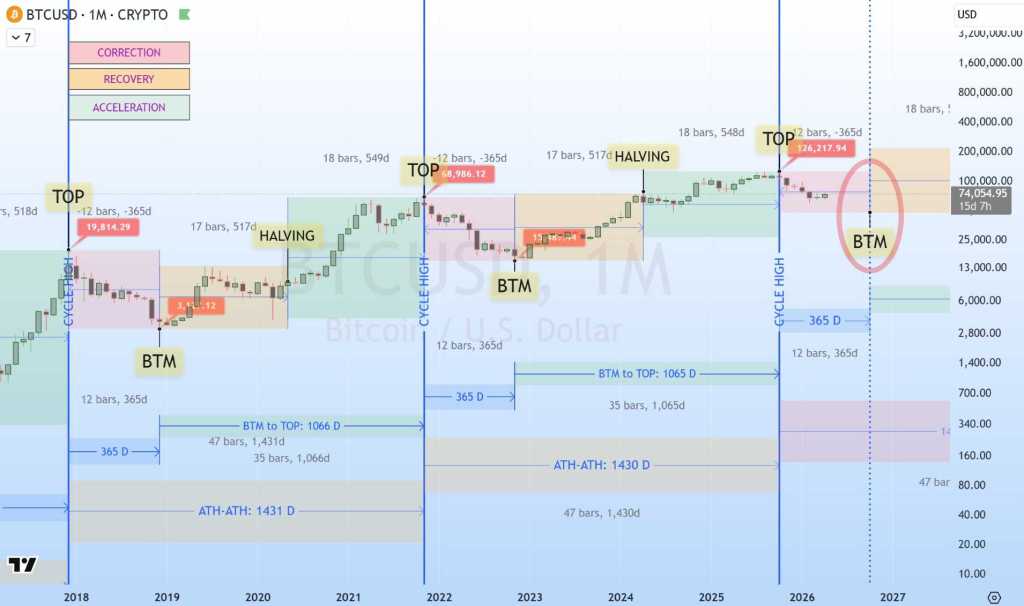
From my estimate, the bottom of this bear cycle will come in early October this year (2026), and we will then enter the recovery stage. I base my theory on the fact that each of the previous bear cycles (corrections) took exactly 1 year to reach bottom, then the market enters a recovery phase, then we have the Halving event, which kick-starts the acceleration phase. The pattern is obvious; the timing is pretty much the same, give or take a few days.
To be more precise about why early October comes up as the bottom week, here’s the same chart, zoomed on the daily TF. The date 6 October could just be the exact time, if history repeats itslef precisely, but I don’t believe in precision, I believe in patterns so I will consider late September to be ideal for entries.
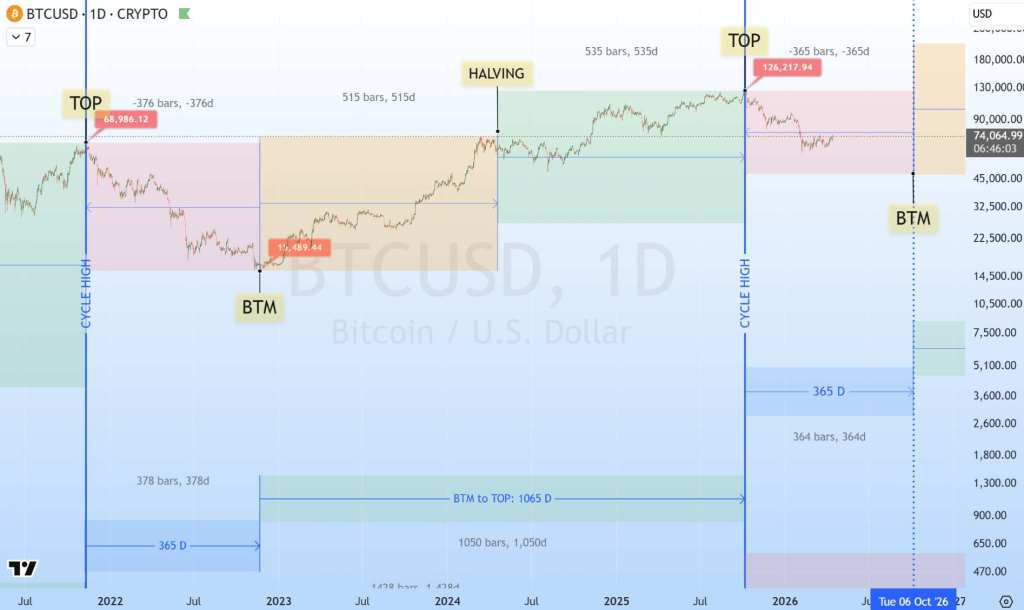
On this chart I am not marking the price point for the bottom, but simply the timing. The first week of October aligns perfectly with historical data. I can’t be certain about the date, but I can expect it to happen around that time, give or take a few days. As a trader, I am not chasing the ultimate bottom price; I position myself around the bottom. I start accumulating once the price goes into support levels, which I will be drawing closer to the time. If you want to keep up with my analyses, make sure to follow me here and on socials, where I post more frequent price analyses for the coins I trade.
Stay informed and level up your crypto strategy
 Sign Up for the Crypto Corner Newsletter and join 10,000+ users to receive my monthly updates and market analysis and keep up to date with the latest releases and developments in the crypto arena.
👉Go to LearnCryptoNow.com for free guides, tutorials and all things crypto

☝Disclaimer: This article is for informational purposes only and does not constitute financial advice. The content of this post reflects solely my own opinions. Purchasing cryptocurrencies poses considerable risk of losses.
Quote Of The Day
“The distance between your dreams and reality is called action.” Dreams become tangible when you take purposeful steps toward their realization. 👍 #Prioritize #EmpowerYourself
Quote Of The Day
Another funny quote I thought I’d share today to start the day with a smile “If you think nobody cares if you’re alive, try…
And My Top eSim Choice Is… (not the one you expect)
If you’ve been following my travels, you know I spend around 9 months of the year on the road. As a digital nomad, having…
