
Bitcoin has emerged from its bear market lows with remarkable vigour, establishing itself as one of the top-performing assets in this bull cycle. Its performance has outstripped many of the altcoins, even those who historically outperformed it in every previous cycle, like Eth and many of the other top ranking atls by mcap. Here’s how this cycle is much different than the ones prior.
Key Developments Fueling Bitcoin’s Performance
Launch of Bitcoin ETFs
The historic launch of Bitcoin exchange-traded funds (ETFs) in January was a watershed moment for the cryptocurrency market. These ETFs became the most successful launches in history, collectively amassing over $100 billion in assets under management within their first year. This influx of capital significantly contributed to Bitcoin’s year-to-date return of approximately +126%, dwarfing the performances of traditional assets like the S&P 500 (+26%), NASDAQ (+33%), and gold (+28%).
Regulatory Support
A new administration in the United States has signaled increased support for the cryptocurrency industry, which has bolstered investor confidence. This regulatory backing is crucial for legitimizing Bitcoin and encouraging institutional investment.
Monetary Policy Shift
The Federal Reserve’s pivot toward an easing monetary policy has also played a pivotal role. As interest rates are expected to decrease, risk assets like Bitcoin become more attractive to investors seeking higher returns.
So far, we’ve been having a very bullish couple of years for Bitcoin and the overall crypto market as whole. However, time is running out and everyone knows that after a bull cycle, we have to get ready for what’s coming next. The trend reverses and we fall into bears hands. Indeed a bear cycle is the natural progression and has been so since the dawn of days. Despite much talk to the contrary, I don’t buy the narrative about a non-ending bull cycle and different market dynamics that will somehow spare us from having another long crypto winter. Yes, the cycles could get shorter, but even if so, they won’t just disappear and market corrections of 60-70-80% are bad enough to wreck any investor’s portfolio, so instead of being caught out of the blue, let’s try and use some tools to identify possible trend reversals and anticipate with some more conviction what is inevitable, shall we.
Here are some charts that can help you identify such occurrence and thus, help you get ready for when the time comes.
Market Dynamics and Indicators
Despite Bitcoin’s notorious short-term volatility, its long-term growth trajectory remains strong. The price of Bitcoin is primarily influenced by supply and demand dynamics, which are transparently tracked on its blockchain. This transparency provides investors with critical insights into potential price movements.
As we look ahead into 2025, several indicators can help us navigate this market and be prepared for future volatility or even the end of the bull cycle:
Exchange Balances / Exchange Net Flows
Centralized exchanges are where most Bitcoin trading occurs. Currently, around 2.5 million Bitcoin (12.6% of circulating supply) are held on these exchanges, down from approximately 3 million at the start of the year. This trend suggests that holders are increasingly moving their Bitcoin to private wallets for long-term storage, reflecting growing confidence in its value and concerns over centralized exchange risks. Historically, rising exchange balances indicate selling pressure, while declining balances suggest bullish sentiment.
MVRV Z-Score
The MVRV Z-Score is an on-chain valuation tool that helps identify when Bitcoin may be overvalued or undervalued. It compares Bitcoin’s market value to its realized value (the average price at which coins last moved). A Z-Score above 6 typically signals overvaluation and potential sell opportunities, while a score below 3 indicates undervaluation and strong buy signals. Currently, the MVRV Z-Score is under 3, suggesting room for growth before overheating occurs. As it evident from the chart below, market peaks coincide with MRVR spikes, which is an easy way to identify potential zones of interest. It’s a very easy chart to read.

1+ Year HODL Wave
This metric tracks the percentage of Bitcoin that has remained untouched in wallets for over a year. A decline in this percentage often indicates profit-taking by long-term holders as prices rise, while an increase suggests accumulation during market lows. Observing shifts in this metric can provide insights into market cycles. This however, will be a little harder to use as a prediction tool since you never know if you should expect a bigger drop (in holders) or have we reached the lowest rate for the current cycle, so this chart is more useful for overall analysis and with a hindsight. It will be more useful when combined with more indicators, so we’ll turn to other ones for more clarity.

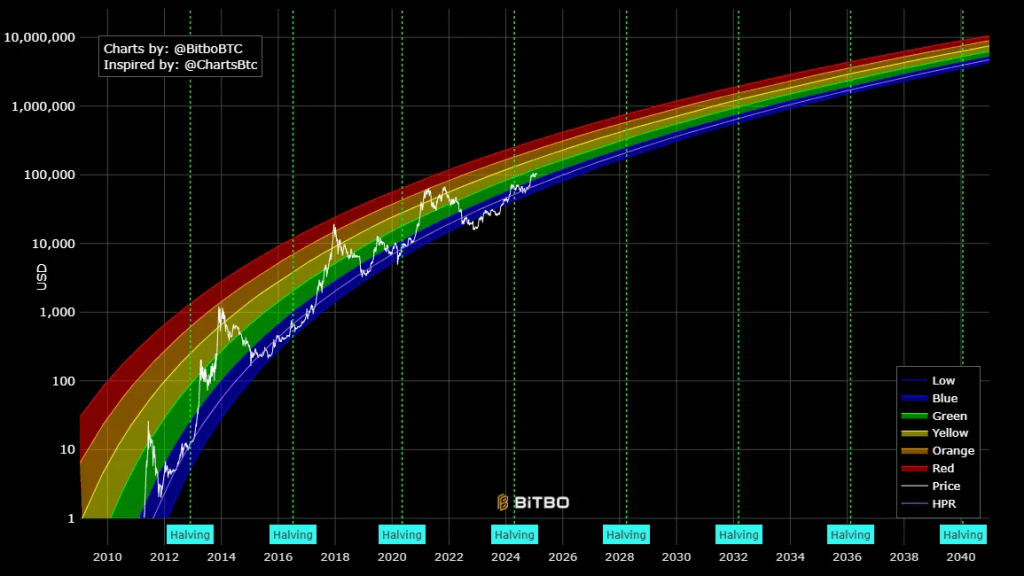
Bitcoin Rainbow Chart
The Halving Price Regression (HPR) is a non-linear regressions curve calculated using only the bitcoin prices on the 3 halving dates. This method excludes the hype cycles to create a conservative trend line. The blue band is on trend (+/- 6 month) with each band above being another year ahead of the trend line.
To keep it simple, what you can do here is monitor when Bitcoin enters the heated zones (yellow, orange, red) and this is where we observe market tops. In the past, we used to print a top only when we get close to (or into) the red zone, but with higher value and diminishing returns, Bitcoin seems to be more likely to print a top closer to the orange zone now. As evident from the chart, we are way below that still, so we have time to jump into the yellow and possibly touch the orange zone before we can call a top.
Bitcoin Pi Cycle Top Indicator
Last but not least, here is my favourite indicator and I would say, the most accurate of all to date.
The Pi Cycle Top Indicator is a technical tool used to identify potential peaks in Bitcoin’s price cycles. Introduced by Philip Swift of LookIntoBitcoin in April 2019, it leverages two key moving averages (marked in cyan and magenta) to provide insight into when Bitcoin might be approaching a local or cycle top. You could find the Pi indicator on some charting platforms, like Aurox, which I use all the time, but for those who don’t have access to those, you will find the chart on this website.
The Pi Cycle Top Indicator signals a potential market top when the Cyan Line (111DMA) crosses above the Magenta Line (350DMA x2). This crossing point suggests that Bitcoin’s price might have accelerated too rapidly, potentially indicating a peak in the current cycle. In my experience, this indicator is very accurate in pointing the exact time of a cycle top despite the double top in our last cycle, where the indicator printed a cross at the first top and not the second, but as it became clear later on, the first peak was marked by most indicators as the actual market peak and from there we started a corrective trend, in which the second peak was a partial bounce.

Bitcoin’s resurgence as a leading asset in 2024 highlights its resilience and growing acceptance within the global financial ecosystem. The combination of successful ETF launches, supportive regulatory frameworks, and favorable monetary policies has laid a solid foundation for this bull market.
So, there you have it. These 4 charts are perfectly accurate and pretty much all you need to follow if you are concerned that we’ve approached a market top. But fear not. Even if you aren’t confident enough on how to read these charts, I’m here and I will certainly alert you when I see the charts showing us signals for this happening. Just make sure to follow this blog and my Youtube channel, where I post regular updates about these things.
Recommended:
 👉 Sign Up for the Crypto Corner Newsletter and get more insight on the crypto markets, new releases and updates, plus my personal choice of coins to trade: https://www.ojjordan.com/crypto-corner
 👉 LearnCryptoNow is the go-to place to get valuable resources and learn more about blockchain tech and all things crypto-related: https://www.learncryptonow.com/
![]() 👉Brave Browser is my top choice for extra security while browsing online. It is privacy-oriented, web3-enabled and blocks unnecessary cookies and much more: https://brave.com/ojj095
👉Brave Browser is my top choice for extra security while browsing online. It is privacy-oriented, web3-enabled and blocks unnecessary cookies and much more: https://brave.com/ojj095
 👉Token Metrics is the platform I use for uncovering unknown gems and to monitor my crypto watchlist. They have the most detailed statistics and analysis for all major cryptocurrencies and price predictions to help you find the right coins to trade and the right time to buy/sell – give it a try and get 10% discount: https://bit.ly/token_metrics

Want to know how to make money by investing in crypto?
Grab a copy of my best-selling eBook “Learn Crypto” to find out all about the cryptocurrency market, the different blockchains and the “Do”s and “Don’t”s of how to build a successful crypto portfolio. It’s now in its second edition.Find out more: LearnCryptoNow.com

“Crypto Wallets” is a Free eBook to guide you in choosing the right wallet for you. All the popular Hot and Cold Wallets are reviewed in this useful guide, most of which I personally use, or have used in the past. Self-custodial and custodial services too.
Find out more at: https://www.ojjordan.com/crypto
⚠️ DISCLAIMER ⚠️
The information contained in this video is for informational purposes only. Nothing herein shall be construed to be financial or legal advice. The content of this post reflects solely my own opinions. Purchasing cryptocurrencies poses considerable risk of losses.
Quote Of The Day
Passion fuels great work; love transforms work into art. Embrace the challenge for personal growth. #EmbraceTheChallenge #PersonalGrowth
Bitcoin Drops Again. Is It Time To Buy Yet?
Caught between fear and greed, BTC just dropped again this morning, hitting $65k. It’s a move I charted just 4 days ago and without a miss,…
Quote Of The Day
“The only place where success comes before work is in the dictionary.” – Vidal Sassoon This poignant quote underscores the fundamental truth that hard…
